The S&P 500 closed up 1.3% this week after a strong finish on Friday, driven by an unexpectedly strong jobs report. Although world equity markets were better on Friday, most markets outside of the U.S. were down for the week. The robust June employment data put to rest economic worries generated by the dismal May employment report. Housing price data and favorable ISM purchasing manager data for both manufacturers and services also suggested a healthier U.S. economy. Our 2% or higher GDP forecast for 2016 looks safer after this week’s economic data.
At the same time a combination of Brexit-related stimulus measures from outside the U.S. and modest month-to-month wage growth as well as falling commodity prices made a Fed rate increase seem implausible to most. The 10-year U.S. Treasury bond yield decreased from 1.45% for the week to 1.36% despite the improved economic data out of the United States.
Those low rates are expected to continue. Futures-based expectations data show just a 10% probability of a Fed rate increase in 2016. Even the probability that the Fed would move rates higher by next June was just 33%. Lower commodity prices (commodities had another very bad week, falling 4.2%) and a stronger dollar suggest that the Fed may have a little more wiggle room than we expected. Still, to us the market seems to be a least a little too optimistic as service inflation remains elevated.
Headline Employment Looked Unbelievably Strong, Masking Some Modest Slowing
Headline employment grew by an astonishing and unexpected 287,000 jobs in June, basically offsetting May’s terrible performance of just 11,000 jobs added. Averaging the two figures together produces job growth of about 150,000, which is just about where it should be given GDP growth levels. (Tricky seasonal factors are likely to blame, raw job growth in May and June were roughly the same, about 600,000 jobs.) So while the June numbers weren’t nearly as good as the stand-alone figure suggests, it clearly erased the fear that the U.S. economy was quietly sliding into a recession.
We have said many times that the poor May jobs report was not supported by any other job market indicator (job openings, initial unemployment claims, or Challenger Gray layoff data). Our only real surprise was that May data wasn’t sharply revised; instead, we got the shockingly good June number.
Either way, putting the two months together showed modest slowing–certainly not robust enough growth to scare the Fed into action. In fact, year-over-year averaged growth rates continued to slow and are likely to continue doing so for the rest of the year.
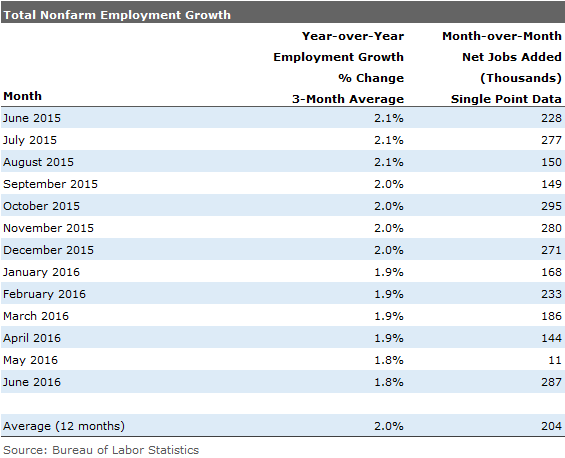
Month-to-Month Employment Data All Over the Place, Intermediate Term Slowing
Despite the monthly volatility shown below, year-over-year growth rates have quietly slid from about 2.1% to 1.8%. We suspect that could and maybe should slide a little bit further, as we discuss later in this report.
Look Back to the 1990s to Find Job Growth This Consistent for So Long
Although we are not excited to see the employment rate growth slow, we note that employment growth has been remarkably stable for a very long period of time. That stability has come at the price of modestly lower overall growth rates.
There Is Some Slowing in Employment Growth, Likely Tied to Slower GDP Growth
GDP growth typically runs 0.5%-1.0% ahead of employment growth because of productivity gains. This recovery, that rate has averaged a bit lower at 0.3%. However, there was at least one recent quarter when GDP growth equaled employment growth, which is highly unusual. It’s also not good for corporate profits and the U.S. competitive position.
Source: BEA and BLS, Morningstar Calculations. Second-quarter, third-quarter, and fourth-quarter 2016 are estimates.
The graph above shows that the gap between GDP and employment has begun to return to normal and, if our forecasts prove correct, the gap could be higher than 0.5% by the end of the year. Slowing GDP growth and constant employment growth were not compatible over the longer term.
It’s Not All About Employment Growth, Either
While employment growth is a key ingredient in total wage growth, hours worked and wages can be equally important. Month-to-month wage growth was a modest 0.1%, which soothed some investors and bondholders. However, single-month, year-over-year wage growth hit 2.6%, the highest level recorded during the recovery. Given the low productivity noted above, higher wages, and little ability to raise prices, the profit outlook is far from ideal.
In the table below, note that hourly wage growth has been higher than employment growth since October.

Wage Growth Healthy but Suppressed by Fast-Growing Low-Wage Sectors
Year-over-year wage growth was very healthy despite some really tough headwinds that suggest wage growth may be stronger than the headline data indicate. The table shows the fastest and slowest growing employment categories and then the average weekly wage for that sector. Note that the low-wage Leisure sector is in the list of fast growers. Meanwhile some of best-paying sectors, including mining, have seen little or no employment growth over the past year. That likely means wages on a same-job-to-same-job basis are moving up much faster than the headline data suggests.
Trade Data Good for the U.S., Bad for U.S. Trading Partners
The picture below really says it all. Import growth has gone from 8% to negative 3% over the past year. U.S. exports have fallen less drastically from about 0% to the same negative 3% currently.
Source: Census Bureau
That is bad news for our trading partners. Given the relative strength of the U.S. economy, falling imports are a big surprise and contrary to economic theory. Shifting consumer tastes–from non-U.S. goods to U.S. goods (autos) and to services (restaurants, health, and travel)–are behind the unusually weak demand for imports.
Capital goods shipments into (and out of) the U.S. are also a major factor in the trade data. A rough spell for processing commodities and limited overall growth anywhere in the world are reducing the demand for big-ticket capital goods, especially machinery. These trends, and not Brexit, should be the biggest concern for major export economies.
Brexit Could Be a Bigger Deal Than China; Still Small
We periodically weighed in that what happens with our trading partners has a limited impact on the U.S. economy, but what happens in the U.S. has a huge impact just about everywhere else. U.S. exports have slipped to 12% of GDP in the most recent quarter after being as high as 13.7% in late 2013. In contrast, about 25% of European GDP is for shipments outside of Europe.
That said, Europe is the biggest export market for U.S. goods, comprising almost 3% of GDP. That’s bigger than the minuscule 0.9% that China represents, though it gathers all the headlines.

Mortgage Rates Continue to Drop, Stimulating Housing Market
One of the big fallouts of the Brexit vote has been declining interest rates. Since the beginning of 2016, the rate on 10-year U.S. Treasuries has plummeted from an already low 2.0% to 1.37% this week. This in turn has caused mortgage rates to drop from about 4% to about 3.4% in the latest weekly report from Freddie Mac. The drop has already caused phones at many banks to ring off the hooks with mortgage applications, especially on re-finance activity. We surmise that it may take a little longer for consumers to swing into action on new purchases.
This should be more good news for the housing industry. Most pundits had expected higher mortgage rates to take a toll on housing activity in 2016. Instead, it now appears low rates may aid this key sector, which should have knock-on effects on many other portions of the economy.
[Source:- Morningstar]