
In the 90s, during my long corporate tenure, I spent my waking life in meetings. We were fixated on them. We had status meetings, project update meetings, team meetings, executive meetings–you name it. I’ve heard from friends in IT that meetings are not as common as they were back them, especially since you can chat on Slack now or make a quick Skype conference call, but they are far from extinct.
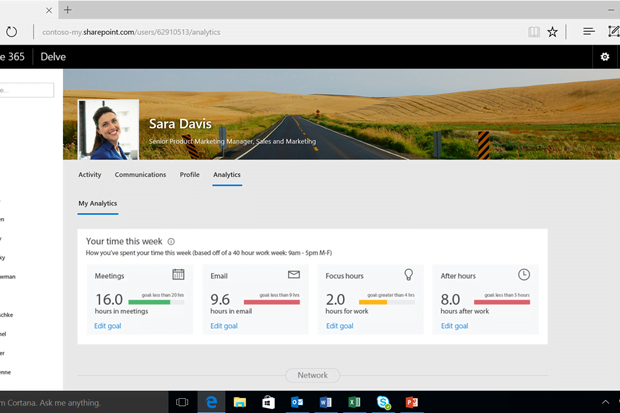
If we had a tool like Office Delve Analytics, a Microsoft application for Office 365 with the E5 plan and free as an Outlook add-on, we would have been more diligent about weeding out some of those meetings. It’s essentially a productivity dashboard that looks at how you spend your time.
For example, you can find out your total time per week spent in meetings and even check the quality of those meetings. How is that possible? Office Delve Analytics looks at things like whether the right people were there, if there were too many management types involved, and factors like length and location. It’s a brilliant way to get insight into productivity.
Delve Analytics gets much more personal, though. You can use it to find out how much time you spent processing email per week — one of those data points you might not want to know, right? Yet, I can see how knowledge workers could easily compare one week to the next and tweak their process, maybe learning some of the flagging functions and using more autoresponders to lower their averages. It’s not quite gamification, but it’s better — a way to turn data into insight and adjust how you work during the week.
It also reveals a lot about email effectiveness — e.g., who is responding to your messages, how long it takes, and how much time you are reading new emails versus writing them. I could see workers making changes in how they deal with email.
Delve Analytics also show how much focus time you take per week. This might be the most useful function, because it shows — at a glance using bar charts — how much time you have worked on projects on your own versus time spent in meetings. Microsoft didn’t go into great detail here, but I’d be curious if the tool can examine how much time you spent writing and editing documents versus checking email; if you are clicking away and browsing while you edit docs; and, if you actually start a document, make changes, and finish it off by emailing it and printing it.
Interestingly, Office Delve Analytics also helps with organizational effectiveness. In one theoretical example, a rep pointed out how a company that spent 7,000 hours in executive meetings might see massive savings. Office Delve Analytics might determine that the execs spent 20,000 additional hours in prep meetings (those that take place before the real meeting) and another 63,000 hours in even more prep. They might see that the execs were spending around 300,000 hours per year on one weekly meeting. The cost was $45M — ouch! The irony is that this might not be an important meeting.
Office Delve Analytics requires an Office 365 E5 plan; admins can learn more about how to install it here. It’s a brilliant way to find out visually if you are getting things done.
[Source:- Computer world]


