Abstract
Virtual memory mechanisms allow offering more RAM memory space to processes than the amount of memory physically available in the system, using disk space as a memory extension. When there is not enough RAM memory to satisfy the active processes’ working sets, the system throughput may be significantly reduced, due to the excessive paging activity. Such situation is known as memory thrashing. This paper presents an evaluation of some commodity desktop operating systems under thrashing conditions. We also identify and discuss the performance data about memory management available in each system and the mechanisms available to collect it. A portable benchmark tool was developed to bring each system to a thrashing situation and then pull it back to normality. The results observed from the systems under study are compared and discussed.
Introduction
In a general purpose operating system, the virtual memory infrastructure allows offering to processes more RAM memory space than that physically available in the system, using disk space as a memory extension. When the memory demand increases, the memory management subsystem selects some memory pages and move their contents to disk, to free some memory to satisfy the demand. When such swapped pages are to be accessed again by their owners (processes), they should be pulled back into RAM. This migration of memory pages between RAM and disk is usually called paging.
As defined by Denning [9], the working set of a process is the set of memory pages it is effectively using at a given moment, including code, data, stack, and heap pages. When the available RAM space is not enough to hold the working sets of all the active processes, paging activity increases, to free RAM space and to load the memory pages requested by the processes. Consequently, the system performance degrades, because the operating system should spend some effort doing I/O to save/retrieve pages to/from the disk, and because processes should wait for the pages they need to be available.
When physical memory is under a stressing demand, a memory thrashing situation may occur. Under such situation, CPU usage falls and the system becomes almost unresponsive, since the application processes are continuously waiting for memory pages to continue their execution. This paper presents a quantitative evaluation of some popular general-purpose operating systems under thrashing conditions. We selected four commodity operating systems and defined our own benchmark tool, which induces a controlled thrashing situation in each operating system under study and then brings it back to normality.
This text is organized as follows: Sect. 2 revisits the concept of memory thrashing, presents some proposed solutions, and discusses how current commodity operating systems deal with it; Sect. 3 presents some benchmark tools used to measure memory performance in computing systems; Sect. 4 discusses the benchmark strategy adopted in this work, presents the developed benchmark tool, and indicates how memory performance measurements were taken in each operating system under study; Sect. 5 describes the experiments performed and analyses the results obtained; finally, Sect. 6 concludes the paper.
This paper is based in a previous work [10], published in a Brazilian workshop (in Portuguese). The present paper includes more details about the experiments performed and a much deeper analysis of their results.
Memory thrashing
The term memory thrashing [8] refers to a situation of memory stress on a computer, in which a large amount of paging I/O activity slows down the execution of processes and makes the system unusable. The dynamics of thrashing in a page-based memory system is somewhat simple: the set of memory pages a process needs for its execution at a given moment is called its working set [9]. If a process does not have its current working set entirely in RAM memory, it generates page faults to retrieve the missing memory pages from the swap area in disk. If the amount of RAM available in the system is not sufficient to hold the working sets of all the active processes, the memory management needs to continuously swap-out (save to disk) pages from some processes to swap-in (load from disk) requested pages for other processes. Due to this cascading effect, the processes’ execution evolves very slowly, since they spend most of their time waiting for the pages they need to be loaded into the RAM. Thus, the CPU usage falls down and the system becomes almost unresponsive.
The thrashing phenomenon is influenced by several factors, such as the amount of RAM memory available, the number and size of the active processes, the locality of reference of their execution, the algorithms used for page selection (for swap-outs) and the disk I/O speed [8]. An obvious remedy for this situation would be to increase the amount of RAM memory available in the system, but this is not always possible and may not solve the problem. In fact, it just pushes the thrashing threshold and consequently reduces the probability of its occurrence, but does not change the system behavior whenever a memory thrashing occurs.
Technical literature has several proposals to manage memory thrashing. After the pioneering efforts done by Denning [8] and his working set model [9], Blake [2] proposed a thrashing control method based in the discrete control theory. It defines a thrashing level indicator to be used as a feedback parameter to a control algorithm that can increase or decrease the multiprogramming level of the system. Among others, Markatos [19] proposed to use memory from other machines in a local network instead of the local disks, to reduce memory thrashing. They obtained interesting results, although the expected performance is heavily dependent on the network traffic.
The works [15, 16] defined a technique called TPF (Thrashing Protection Facility) to manage memory thrashing situations. In this approach, a token is assigned to one process in the system; the process holding the token is protected from the trashing, because its pages are kept in RAM by the swapping mechanism. The allocation of the token to a process follows some rules: (a) the token holder is the same in the last few seconds; (b) the current token holder did not generate page faults since it received the token; and (c) the current active process has not received the token recently.
More recently, Reuven and Wiseman [30] proposed a mid-term process scheduler that takes into account the whole RAM usage. The active processes in the system are separated in a number of “packs” according to their RAM usage. The size of each pack should be the closest to the system’s free RAM space. Grouping the active processes into packs means solving a classic bin packing problem. The process packs are then scheduled using a round-robin policy; inside a pack, processes are scheduled by the standard OS scheduler. This mid-term pack scheduler ensures that the RAM demand for the active processes in a pack fits the available RAM space, thus preventing memory thrashing. Since the pack scheduling quantum is longer than the system quantum, interactive and real-time processes should be treated separately.
In the following, approaches for thrashing management present in some popular COTS operating systems are discussed. The FreeBSD operating system detects thrashing through the monitoring of the RAM usage level [24]. When the free RAM memory is low and there is a high rate of page requests, the system is presumed to be under thrashing. The memory management subsystem then tries to reduce the thrashing by not allowing the last active process to get back to the CPU for some time. Such approach allows the memory subsystem to discharge all the pages of the last active process to disk, freeing up memory for the other active processes. If the thrashing continues, more processes are chosen to be blocked and swapped out, until the page fault rate decreases. Blocked processes can return to activity after 20 s, which may cause a new thrashing, leading to other processes being blocked, and so on.
The current Linux kernel implements a variant of the TPF approach [16], as defined by Jiang and Zhang [17]. However, in cases of extreme trashing, the prevention algorithm is left aside and the memory manager starts to choose and kill “bad” processes, using an appropriate heuristics, until the memory demand is reduced to manageable levels [3].
The memory manager of the OpenSolaris operating system defines three working states: normal, soft and hard swap. In the normal state, it uses a classic paging mechanism (a version of the well-known two-handed clock algorithm [35]). If the amount of free RAM falls below a predefined threshold called desfree for more than 30 s, the system switches to the soft swap state, in which entire processes are swapped out to disk. If paging activity remains high even after swapping some processes, the system enters the hard swap state, in which the system kernel unload all unused modules and free its memory cache. It also moves the processes that are sleeping for a long time to the disk, one at a time, until the paging activity decreases enough to resume the soft swap state [20].
Finally, Windows XP uses a variable-length file as its swap area, which may be increased in memory outage situations. The page selection algorithm is based on the working set concept [33]. A kernel thread periodically reviews the sizes of all processes’ working sets, “stealing” pages from some processes if the free RAM space is low. Another kernel thread gradually moves processes suspended too long to the swap area. Unfortunately, no clear mention to thrashing management policies for the Windows OSes was found in the available technical literature.
Tools for memory benchmarking
Most memory benchmark tools are designed to measure the speed of operations involving RAM and its associated caches. Two frequent measures are the memory bandwidth and memory access latency. This section presents some tools for memory benchmarking, initially those that run on more than one operating system and that are open source (an important project feature that ease understanding how each tool performs its measures).
The Bandwidth tool [34] measures the speeds of read/write operations in L2 cache, RAM memory, and video memory, and the speed of memory-related C functions like memset, memcpy, and bzero. The CacheBench tool [27] program evaluates the cache hierarchy performance, measuring its various bandwidths. The LMbench tool [25] program runs in UNIX systems and measures only the data transfer rate between processors, cache, memory, network, and disks. The nBench tool [21] evaluates the performance of CPU and memory bandwidth, simulating operations performed by popular applications. Finally, Stream [23, 22] is a portable tool for measuring the time required to copy memory regions and also some bandwidth values.
The Standard Performance Evaluation Corporation (SPEC) maintains a set of benchmarks for modern computers [14]. The SPEC CPU tool runs on Unix and Windows systems and allows to measure the CPU performance, compiler performance, and memory bandwidth. In addition to these tools, SPEC provides several other tools, but none of them provides functionality to specifically evaluate the response of a system under memory thrashing conditions.
Evaluation of system behavior under thrashing
The objective of this study is to evaluate the behavior of some popular operating systems under thrashing conditions. We do not intend to propose new algorithms to deal with this problem, neither to evaluate state-of-the-art algorithms like those discussed in Sect. 2, but to evaluate the solutions currently available in commodity systems. For this study, we selected the FreeBSD, Linux, OpenSolaris, and Windows XP operating systems, because they are the main desktop operating systems natively running on the standard Intel x86 platform.Footnote1 Such hardware platform was chosen due to its availability and good driver support. The operating systems chosen may operate in desktop mode or as a multi-user remote terminal servers. In this last context, the thrashing effects may be particularly problematic, because the action of a single user may directly affect the system availability for the other users.
Since an adequate tool to evaluate the behavior of an operating system under memory thrashing was not available, an ad-hoc benchmark tool was developed. Our tool brings the system from a normal operation state to a memory thrashing situation and then brings it back to a normal state. Thus, it allows to evaluate how each system manages the memory during the thrashing and how fast the system recovers when the demand for physical memory comes back to normal levels. The behavior of each system was observed by monitoring the CPU usage in user and system levels and the rate of pages being read or written to disk (respectively, page-in and page-out rates). Each system provides such information through its own API, thus a platform-specific measurement program was required to collect performance data in each system.
The benchmark tool
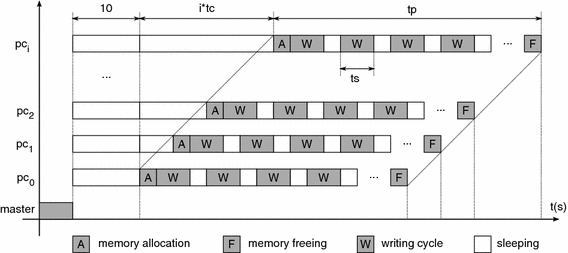
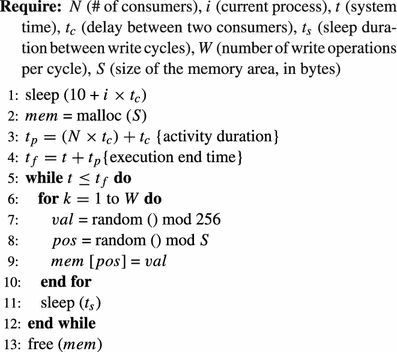
The benchmark tool has three components: a set of N consumer processes that are responsible for inducing the memory thrashing, a measurement process that collects performance data, and a master process that manages the other processes. Each consumer process allocates a large memory area (using standard malloc), seen as a large byte array. It then performs write cycles at random bytes in this array, interleaved with sleeping periods, as shown in Fig. 1. Its temporal behavior is described by the following algorithm:
An artificial workload was chosen instead of a real application because the memory access patterns of real processes are very variable, depending on their purpose and even in what they are doing at a given moment. For instance, memory-hungry applications like a CAD system, an image editor, or even a document indexer have very distinct memory needs and access patterns during their lifetime. Due to this heterogeneity, an artificial workload with a poor locality of reference represents a general “less favorable case”. Our benchmark tool is inspired from the workloads described in [28, 29], in particular workloads 2 and 3, in which the write operations are done at random bytes in the allocated memory area, to keep a low locality of reference and thus to not favor any specific operating system.
The benchmark parameters whose influence was studied are: the number of write operations in each write cycle (W), the sleeping time between two write cycles (t s ), and the delay between two consumer processes’ activations (t c ), i.e. the interval between the start of activity of two successive consumer processes ( and
and  ). Other parameters were also studied, but these showed to be the most relevant ones in all the experiments performed.
The consumer processes were written in ANSI C, due to its portability. Therefore, the consumer program is exactly the same in all the four operating systems under evaluation. The measurement process was also written in C, with an exception for the Windows operating system, in which a native measurement tool was adopted. The master process was written in Java, since its process creation API is platform independent. As seen in the algorithm presented in this section, each consumer process waits at least 10 s before starting to work; this initial sleeping time was defined to avoid any impact of the Java runtime loading on the behavior of the consumer processes.
Performance data collection
Basically, the measurement process periodically collects data about CPU and memory usage as provided by the kernel and saves it to a file. The measurement period chosen was 1 s, which is enough to represent the dynamics of the phenomenon being studied. The measurement process is specific to each operating system, because the interfaces to access kernel statistics are distinct for each system, as described in the following and summarized in Table 1. We consider that the mechanisms offered by each operating system to provide kernel statistic data are reliable and accurate.
In the FreeBSD OS, the sysctl tool allows to query more than 500 kernel variables organized hierarchically. The variables related to CPU and memory usage are: kern.cpu_time (an array with CPU times at user and system levels), vm.stats.vm.v_swappgsin (number of pages read from disk in the last second) and vm.stats.vm.v_swappgsout (number of pages written to disk in the last second).
The Linux kernel implements the /proc virtual file system [6], which offers a hierarchy of kernel information through an abstraction of files and directories. Many Linux monitoring tools like top and vmstat use the /proc file system as a primary source of information. In the experiments described here, the CPU usage data were obtained from the file /proc/stat, while the paging I/O data were obtained from the file /proc/vmstat (fields pgpgin and pgpgout).
OpenSolaris provides statistic information about the kernel and its modules using a facility named kstat, through which the kernel subsystems publish their data. Access to this facility is done using the virtual device /dev/kstat and a set of functions. The kstat_data_lookup function allows to lookup for a specific counter and to retrieve its value. The counters of interest here are: cpu_ticks_user (CPU time at user level), cpu_ticks_kernel (CPU time at system level), pgswapin (pages read from swap in the last second), and pgswapout (pages written to swap in the last second).
Finally, the Windows XP OS does not offer a public API to collect data from the kernel. Instead, a native tool called perfmon (from Performance Monitor) allows to access the system performance data provided by the kernel. Windows classifies computer resources as objects, which are associated with counters. The counters considered here concern the object “CPU” and the object “memory”: %User Time (CPU time at user level), %Privileged Time (CPU time at system level), Pages Input/sec (pages read from swap in the last second), and Pages Output/sec (pages written to swap in the last second).
The experiment environment
The experiments were performed in an IBM PC ThinkCentre S50 computer, with a 32-bit Intel Pentium IV 2.6 GHz processor, an Intel motherboard using the 865G chipset and a 533 MHz front-side bus. The machine had 1 GB of DDR-RAM PC2700, with 333 MHz clock and 6 ns access time. Standard page size in the platform is 4 Kbytes. The hard drive used was a Seagate Barracuda ST3400E3 40 GB IDE (ATA-100 connector, 2 MB internal buffer, 7,200 RPM speed, 100 MB/s peak transfer rate and 8.5 ms seek time).
The hard disk was divided in four equal primary partitions, one for each operating system, installed in this order: (1) Windows XP, (2) FreeBSD, (3) OpenSolaris, and (4) Linux. To keep the structure of all systems as similar as possible, a 2 GB swap file was used as swap area inside each partition, since the Windows platform does not use a separate swap partition. Normally, performance impact of using a swap file instead of a swap partition is negligible, as discussed in [26]. Also, the implementation of swapfs in SunOS shows that adding an indirection layer between RAM and its backing store does not impact swapping performance [4].
It is well known that cylinder position has an influence in data transfer rates. However, other factors also influence data access performance, like track-to-track latency, bus and memory speeds, etc. We evaluated the performance of the disk used in our experiments, according to the position of the data being accessed, for both sequential and random access, to better estimate the impact of placing each operating system at a given partition.
Sequential read/write access performance was measured at the disk interface level, using the standard UNIX hdparmFootnote2 and ddFootnote3 tools. Random read/write access performance was measured at the filesystem interface level, using the sysbenchFootnote4 tool on the Linux’s Ext2 file system; we found no reliable tool to perform random access benchmarks at the disk interface level. According to Ruemmler and Wilkes [32], swapping workload on disks in UNIX systems may be characterized as synchronous and composed of 70–90 % reads. Such characterization was taken into account to define the parameters of the benchmark tools.
Table 2 shows transfer rates measured in the four disk partitions created to host the operating systems. The biggest performance gap was 5.64 %, observed between partitions 1 and 4 in the sysbench random read/write access test.
To better understand the impact of disk position in access performance, a finer-grained evaluation was also performed. A primary partition of 1 GB size was created at successive disk positions and its access performance was evaluated using the same tools. Figure 2 shows the performance observed for the disk used in our experiments. It is possible to observe that there is some performance degradation at the end of the disk (the 37–40 GB region), mainly for large sequential read accesses. Since such disk region was not used in the experiments (operating systems occupied only around 10–15 % of each partition after installed), and since swapping usually deals with small groups of contiguous pages, the performance degradation observed in the disk evaluation does not have a significant influence in the results. Moreover, this work focus the overall behavior of each operating system; any fine-grained quantitative comparison among the systems under study should take into account such performance parameters.
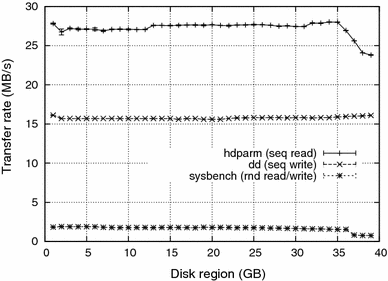
It should be also observed that more recent, higher density disks show a more intense performance degradation according to the disk region, as shown in [18] and [7]. Due to the strong advances in chip technology, bottlenecks due to controller, bus, memory, and processor performance are much smaller in more recent systems, putting in evidence the mechanical properties and restrictions of hard disks.
A default desktop installation was performed for each operating system and only the default processes of each operating system were running during the experiments. The compiler chosen was GCC (GNU Compiler Collection), since it is widely used and has versions for all the operating systems being evaluated. No specific compiler optimizations were used. Table 3 shows the configuration of each system just after the system startup, including the number of running processes, the amount of free RAM memory, the RAM space used for disk cache, and the swap area already in use.
Experimental results
The experiments aimed at evaluating the influence of the parameters described in Sect. 4.1, i.e. the number of write operations in each write cycle, the delay between write cycles and the delay between the starting of two consecutive consumer processes. For each parameter, its influence on the CPU usage and on the number of pages being read (page-in) and written (page-out) was observed. In each experiment 25 consumer processes were created (N=25N=25), each one allocating a 100 MB memory area (S=100S=100 MB). Such parameters were chosen empirically, to bring each OS to a deep thrashing situation, while avoiding memory exhaustion. The possibility of memory exhaustion was checked by testing all memory allocations during the execution and by examining all the system logs after each experiment.
Performance data were collected each 1s1s by a measurement process running with default priority and super-user permissions. The interference of the data collector itself was estimated negligible, since experiments performed with the collector running at different sample rates (1, 10, and 30 s) provided equivalent results in terms of overall behavior. The machine was rebooted after each measurement.
As discussed in Sect. 2, the expected behavior of an operating system during thrashing is to present a low CPU usage at user level, since user processes continuously wait for missing pages and progress slowly. System level activity is expected to be moderate or even high, specially if paging algorithms are complex. Page-in and page-out activity are also expected to be high, to satisfy the pages demanded by user processes (page-in operations) and to free RAM space for them (page-out operations).
Experiments
Table 4 shows the experiments performed. They investigate the influence of the benchmark parameters WW (number of write operations per cycle), tsts (sleep time between two write cycles), and tctc (interval between the start of activity of two successive consumer processes), on the systems’ CPU usage and paging activity. The first two experiments ( e1 e1 and e2 e2) investigate the influence of the number of write operations in each write cycle. Together, experiments e2 e2 and e3 e3 allow to analyze the influence of the sleep between write cycles, and experiments e2 e2 and e4 e4 allow to evaluate the impact of the interval between two consumer processes’ creation. For each experiment, two diagrams for CPU usage (user and system level) and two diagrams for paging activity (page-in/sec and page-out/sec) were created. User level CPU usage is mostly related to the processing of consumer processes, and system level processing is generally due to kernel activity.
The performance data measured in all experiments showed an important variability, making their direct visualization and interpretation unfeasible. To overcome this problem, collected data were “smoothed” using Bézier curves, allowing to graphically present the measured results in a meaningful way. This problem can be seen in Fig. 3, which shows some results before and after the Bézier smoothing procedure. Therefore, all the graphics presented in the following sections do not indicate the exact values observed for each individual performance indicator, but their “smoothed” behavior. This approach may hide some local peaks and valleys in the curves, but it is satisfactory to depict the “high-level behavior” of the systems in each experiment. Furthermore, the stability results (presented in Sect. 5.5) allow one to infer that such behavior is adequately represented by the smoothed curves.
Impact of the number of operations per write cycle
The only difference between experiments e1 e1 and e2 e2 is WW, the number of write operations in each write cycle. Indirectly, WW represents how CPU-bound is a process; in this sense, higher WW values mean more processing during each cycle. In the workload, each worker allocates a 100 MB area (25,600 pages of 4 KB), in which it performs cycles of WW write operations (W=1,000W=1,000 for e1 e1 and 10,00010,000 for e2⋯e4 e2⋯e4). Considering that accesses are issued at random positions, the probability of a given page to be accessed more than once in a single write cycle is ≈0.07%≈0.07% for W=1,000W=1,000 and ≈5.9%≈5.9% for W=10,000W=10,000. This means that the number of distinct pages touched in each write cycle roughly corresponds to WW. Observed results are shown in Figs. 4, 5, 6 and 7.
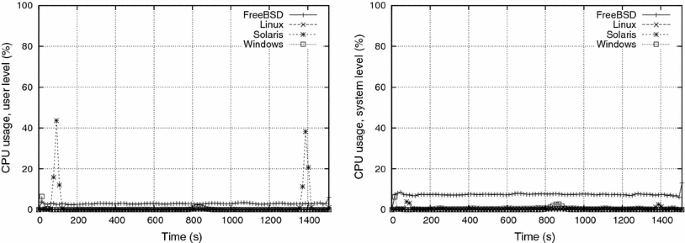
During e1 e1, both paging activity and user/system CPU usage were generally very low (Fig. 4). This means that the consumer processes’ workload did not affect the systems significantly. One exception is OpenSolaris, showing peaks of 40 % of user-level CPU usage at the beginning and at the end of the experiment (and a corresponding small increase in the system level CPU usage too). Such high CPU activity seems to happen when the system enters or leaves the soft swap state (cf. Sect. 2), thus probably some of the OpenSolaris memory management operations are being accounted as user-level processing time. The other exception is FreeBSD, which presented a CPU usage higher than the others, both at user and system level. As the CPU usage level is almost constant, and is not accompanied by a more intense swapping activity, we attribute such CPU activity to the consumer processes.
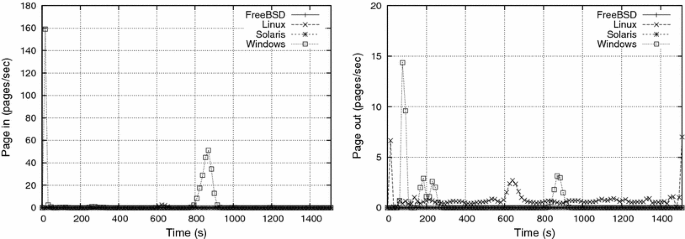
Paging activity during e1 e1 (Fig. 5) was higher in Linux, and particularly high in Windows, whose intense page-in activity during the first seconds may be explained by the paging demanded to load the experiment program and dynamic libraries. The reasons for the paging activity peak at t≈850st≈850s are unclear; we infer that it is related to internal Windows thresholds or time-outs, since no meaningful event happened in the experiment at that time. Also, the Windows XP reaction to memory thrashing was more aggressive than the other systems’, as shown by the page-out peaks at the beginning and the middle of the experiment.
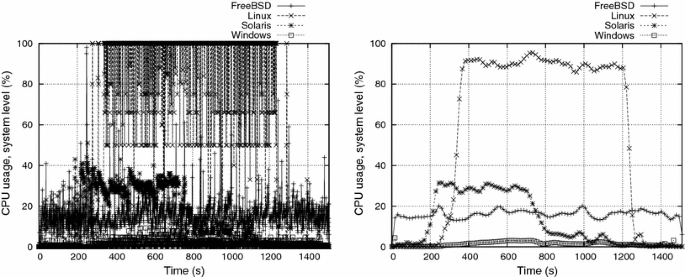
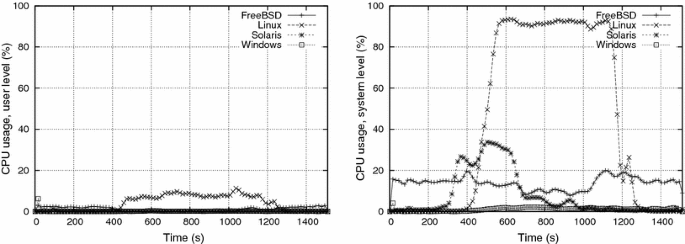
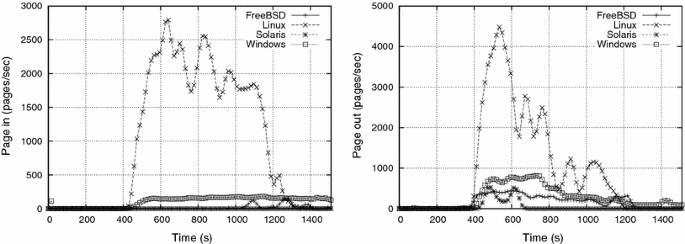
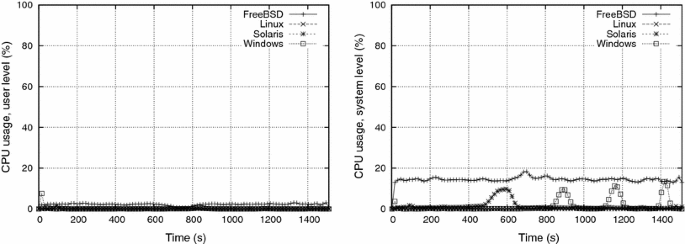
The observed systems’ behavior changed significantly during e2 e2, i.e. all the systems showed more intense CPU and paging activity, mostly between t≈400t≈400 s and t≈1,300t≈1,300 s. Severe thrashing apparently starts at t≈400t≈400 s, when the paging activity suddenly increases in all systems. CPU activity concentrated at system level, due to the virtual memory algorithms; user level activity was very low, except for Linux, which attained the highest levels in this experiment. Thrashing impact was strongest in Windows, whose CPU activity was the lowest among all the systems. In fact, some consumer processes in Windows finished much later than their expected time tftf, during experiment e2 e2.
Concerning paging operations, Linux and Windows were the systems with the highest activity. However, it can be inferred that the thrashing prevention/management mechanisms in Linux are more effective than in Windows, because of the higher user level CPU activity observed. Results suggest that OpenSolaris and FreeBSD reacted to thrashing by swapping out the most RAM-demanding processes, in a tentative to “calm down” the whole system activity. In fact, the page-in activity in OpenSolaris and FreeBSD remains quite low, while their number of page-out operations increased after t≈400t≈400 s.
When comparing e1 e1 and e2 e2 results, the impact of WW is clear: more memory accesses per write cycle means more memory pages being requested, and more effort is required from the paging mechanism. The 100100 ms sleep period of each process between two write cycles seems to be insufficient to decrease such pressure.
Impact of the sleeping time between writes cycles
The influence of the sleeping time between two write cycles can be analyzed by the comparison between e2 e2 (in which ts=100ts=100 ms) and e3 e3 (ts=1,000ts=1,000 ms) results. Figures 6 and 8 show the CPU usage for ts=100ts=100 ms and ts=1,000ts=1,000 ms, respectively, keeping the number of writes/cycle at W = 10,000 and the delay for activating each process at tc=30tc=30 s. Figures 7 and 9 show the corresponding page-in and page-out activity for such experiments.
Increasing the sleeping time tsts has several effects: while it reduces the user-level CPU demand (as processes sleep longer), leaving more CPU time for the kernel mechanisms (if needed), it also reduces the pressure on the paging mechanism, thus alleviating the memory thrashing. Such behavior can be observed in Figs. 8 and 9, which show a less intense paging activity than in experiment e2 e2. The graphics resulting from e3 e3 show thrashing occurring at t≈750t≈750 s, when there is a burst of paging-out activity. It should be observed that experiments e1 e1 to e3 e3 have the peak of their activity in the interval [730,790[730,790s]], when all consumers are active. Only Windows showed an uncommon paging activity, with a lower (but longer) page-out burst, and three page-in peaks (and their corresponding CPU usage peaks at system level). Again, no intuitive explanation was found for such behavior. Finally, we inferred that OpenSolaris reached its soft swap state at t≈500t≈500 s, as shown by the increase in the system level CPU and page-out activity at that time. This early reaction is probably due to the fact that OpenSolaris uses more memory at its startup than the other systems, as shown in Table 3.
Impact of the delay between process activations
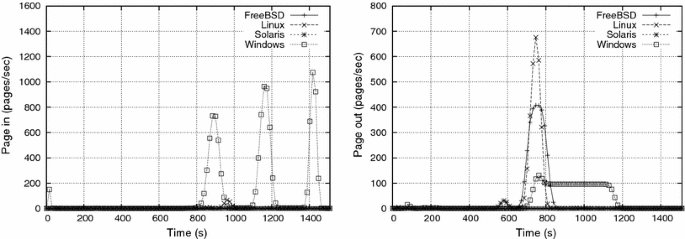
Experiment e4 e4 aims to evaluate the impact of tctc, i.e. the delay between the activation of two consumer processes. Although decreasing tctc also increases the pressure on the paging mechanism, it is distinct from decreasing tsts, because in e4 e4 the memory allocations and deallocations (rows 3 and 14 of the algorithm presented in Sect. 4.1) are done faster, leading to a more aggressive thrashing. Figures 10 and 11 show the CPU usage and paging activity for e4 e4, in which tc=1tc=1 s. They are to be compared, respectively, to Figs. 6 and 7 from e2 e2, in which tc=30tc=30 s (tsts and WW are the same in e2 e2 and e4 e4).
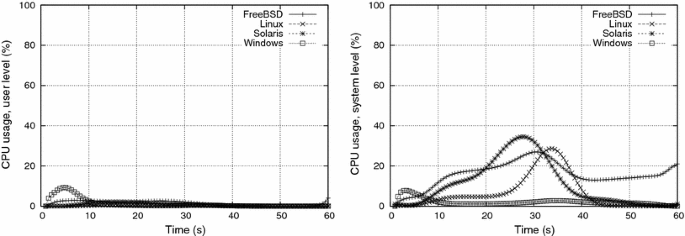
First of all, a smaller tctc obviously leads to a shorter experiment, in which behaviors are more smooth and somewhat similar. There is a fair amount of system level activity in all systems, excluded Windows. We inferred that this processing is due to the kernel virtual memory algorithms, including the thrashing management itself. CPU activity is more intense from t≈5t≈5 s to t≈40t≈40 s, although FreeBSD continues to have a sustained kernel level processing until the end of the experiment. This behavior is probably due to the 2020 s blocking period imposed by FreeBSD to some processes, as discussed in Sect. 2.
Windows showed an intense page-in activity during the beginning of the experiment, distinctly from the other OSes. Since no page-out activity was seen during this period, this page-in activity is certainly related to loading executable code and/or libraries. Such behavior can also be seen in the other experiments, but it is less visible in their graphics due to their larger time scale.
Once again, Linux showed the most intense paging activity during the thrashing period, for both page-in and page-out operations. However, although there is a corresponding kernel-level processing activity, no concomitant user-level processing was observed in this experiment to justify a real performance gain for user processes.
Stability of results
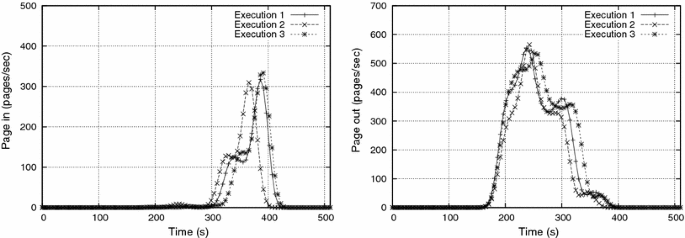
To evaluate the stability of the collected data, each experiment was repeated three times under the same conditions. Given the complexity and dynamic nature of the memory management mechanisms implemented by the systems under study, we expected to observe a large variation in the results obtained during the experiments. However, such variation showed to be quite modest: Fig. 12 shows the results obtained in three distinct executions of an experiment with the FreeBSD system using W=10,000W=10,000 writes/cycle, ts=100ts=100 ms, and tc=10tc=10 s. This was the worst situation observed, all the other experiments presented more stable results, with curves almost fully overlapping for the three executions.
Discussion
As shown in the previous section, all the systems under evaluation presented some level of sensibility to memory thrashing, and each operating system behaved distinctly during the experiments. It is possible to see that Linux had the most intense paging activity during the thrashing, followed by Windows. Paging activity in FreeBSD and OpenSolaris was surprisingly small, under our point of view, specially for page-in operations; this may be explained by the tendency of their thrashing management mechanisms to “calm down” all the processes during a thrashing. In fact, the page-out rates for both systems were quite low during all the experiments, and their page-in rates were almost zero.
Besides the explicit behavior depicted in the diagrams, one should also consider the subjective perception of each system’s usability, i.e. its global responsiveness throughout the memory thrashing. In our experiments, the memory thrashing management mechanisms of the four systems under evaluation were not sufficient to effectively attenuate the impact of this phenomenon on the system usability. Both FreeBSD and OpenSolaris showed the highest degradation of the system usability, as perceived by the user interaction. On the other hand, Windows XP showed a small usability penalty, although the system took longer to recover from the thrashing, from a user’s perspective. Finally, Linux clearly showed the lowest usability degradation and the fastest recovery from the thrashing period. However, it should be stressed that this is only a subjective estimation, not backed by concrete results, and thus should not be considered “as is”. More experimentation should be carried out, using unbiased users, to confirm and quantify such observations.
It is not simple to state a clear judgment about the Windows XP thrashing management mechanism, due to the lack of documentation about it. Although its usability did not suffer from thrashing as much as OpenSolaris and FreeBSD, it showed low levels of CPU usage during the experiments, and did not succeed to execute all the consumer processes during the expected duration of experiment e2 e2, which not completed within the expected time. It also showed a longer recovery time from the thrashing, as shown in Figs. 7 and 9; such longer recovery time was also perceived from the user interaction perspective. This allows to suppose that Windows XP thrashing management uses a mechanism based on delaying the most active processes, similar to that used by FreeBSD.
According to the remarks stated above, it seems clear that the token strategy implemented in Linux [17] behaves better than the “lets calm the things down” strategy adopted by OpenSolaris and FreeBSD. In fact, giving a process the opportunity to keep most of its pages in memory allows it to go ahead until it finishes its processor/memory burst. This strategy, which is equivalent to reduce the multiprogramming level for all but one “elected” process at a time, seems to use more efficiently the swapping infrastructure.
The synthetic workload used in the experiments presented here does not correspond to a specific application; its behavior was conceived to stress the memory system in extremis, due to its strong memory demand, multiple concurrent flows, and very poor locality of reference (leading to a large working set). This workload is similar to the rand benchmark used in [36] and the microbenchmarks defined in [1]. The advantage of a synthetic workload over a real application is that its memory footprint and behavior can be easily modified. Nonetheless, this workload may be considered representative of applications having large working sets and random memory access patterns, similar to the memory-intensive QSim and SMV applications studied in [36] and the HashCache application used in [1]. Such applications represent a worst case for virtual memory mechanisms. Applications having working sets significantly smaller than their memory needs and more regular (i.e. less random) access patterns will present better results.
As observed from the results, the general-purpose operating systems studied still use traditional virtual memory management algorithms whose performance may be improved. An approach that can produce good results in attenuating the effects of physical memory exhaustion is swap compression. The use of compression mechanisms to extend physical memory was first implemented in [11]; his proposal consisted in compressing LRU pages, keeping them in a RAM cache, and sending them to disk whenever needed. The page compression allows to keep much more pages in RAM, avoiding disk accesses, at the cost of some processing. Such approach was revisited in [31, 38] and improved in [5], using newer hardware and better compression algorithms, with very good results, because swap contents showed to be highly compressible [31].
More recently, swap compression has been adopted in COTS operating systems, through projects like CompCache/zRAM [13]. The computing power available in current multicore processors allows compression to be used with a negligible impact in CPU performance. Furthermore, modern hardware provides other resources to help memory management that are not being effectively used by the operating systems, like multi-sized memory pages [37] and performance counters that could be used to detect memory thrashing, or even predict it [12]. Another interesting path to be explored is the increasing availability of large solid-state disks that may be used as swapping devices, as discussed in [1]. Such devices have better access times than hard disks, improving swapping speeds.
Conclusion
This paper presented the evaluation of some popular general-purpose operating systems under memory thrashing circumstances. We proposed a portable tool that induces each operating system to a controlled thrashing and then back to a normal operation. Furthermore, we identified the performance information available in each system and the mechanisms used to collect them. Some experiments were proposed to evaluate the behavior of the systems under study during and after the thrashing phenomenon. The experiments showed that the operating systems under study behaved distinctly during a memory thrashing, showing distinct recovery times and also distinct degradation levels from the user’s interactivity perspective.
System behavior under memory thrashing is still a relevant problem. One may argue that just adding more memory to the system solves it, but this is not true. In fact, adding more memory just pushes forward the thrashing threshold, making thrashing less probable to occur (under the same memory usage conditions), but does not improve the system behavior during a memory thrashing. Furthermore, the recent tendency of multi-core CPUs leads to an increase in the processing power and multiprogramming level; more processes and larger memory page sizes may lead to thrashing even faster. As the demand for RAM space increases, specially for user applications dealing with multimedia or document indexing, the responsiveness of a desktop operating system under memory thrashing continues to be a relevant research issue. Indeed, efficient swap management mechanisms are also becoming relevant in other domains, like virtualized operating systems in large cloud environments.
This study may be improved by considering also other popular desktop operating systems, like MacOS X and more recent Windows operating systems. We are also considering effective methods to quantitatively evaluate the system responsiveness to user interaction before, during, and after a memory thrashing situation. Another point of further research is to evaluate the effects of memory thrashing on well-behaved processes (i.e. processes not directly involved in the thrashing).
[“source=journal-bcs.springeropen”]